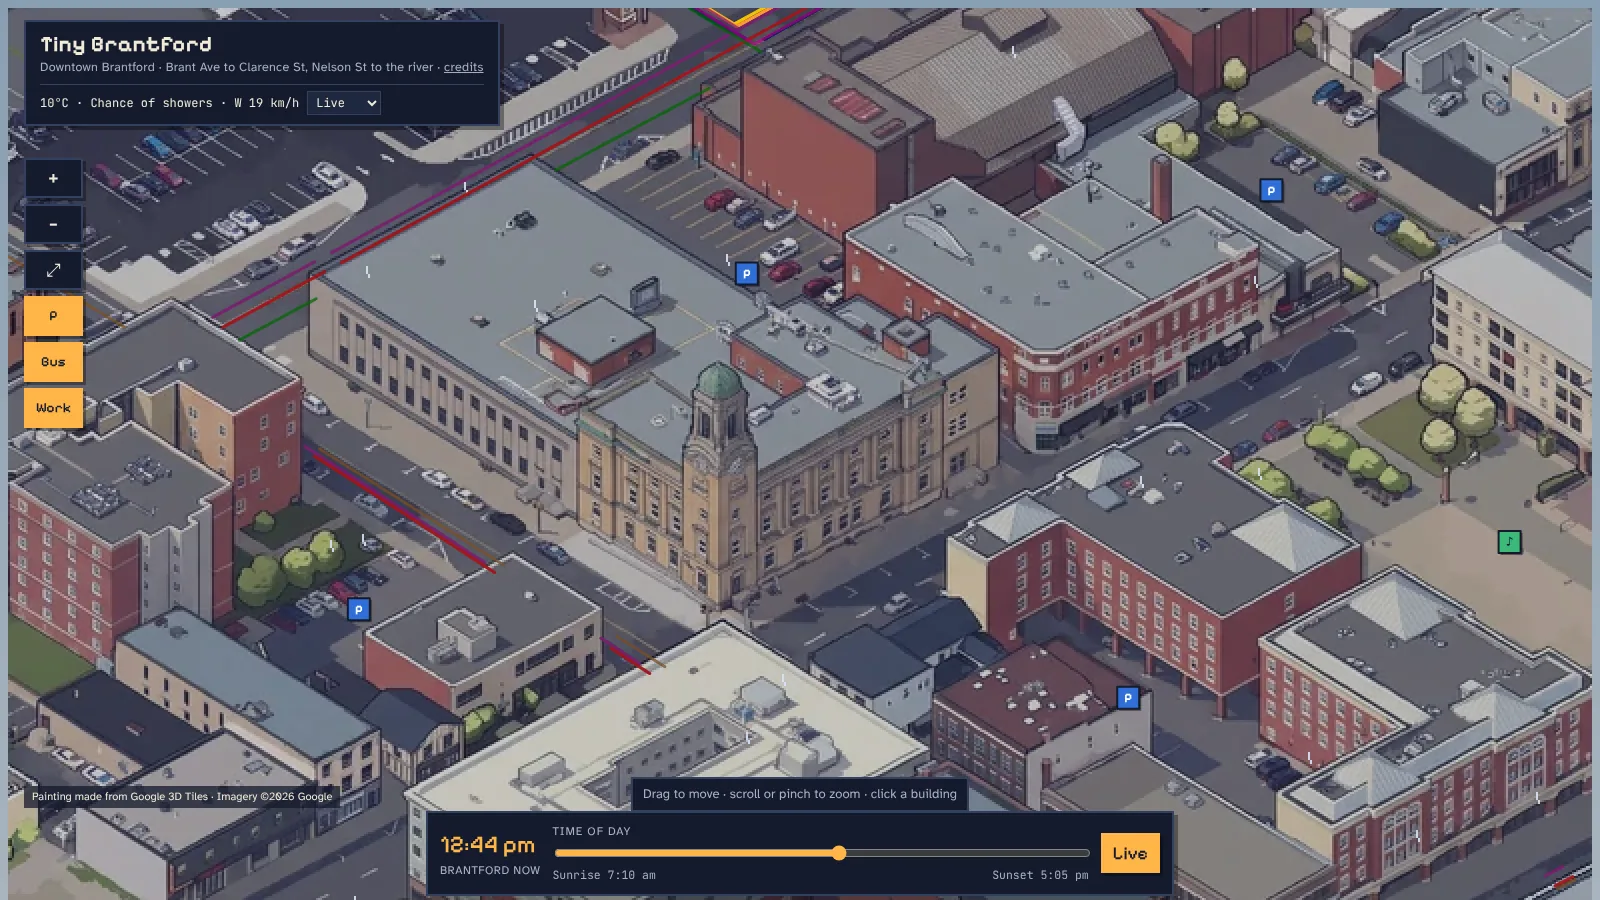
Colborne & Dalhousie, around the old Federal Building (now City Hall)
Side Project · 2026
A painted, clickable pixel-art map of downtown Brantford, Ontario. Every building you see is a real building in the data. Click one for its history and the businesses inside, and watch the city follow the real time of day, the weather and the bus timetable.
Colborne & Dalhousie, around the old Federal Building (now City Hall)
Inspired by Tiny Toronto, I wanted my own city as a little diorama you could actually use: not just a pretty picture, but a map where every rooftop is a real address you can click.
It was also a chance to put my layout background to work outside of film. The whole thing is built around a single locked camera: a true isometric view at 35.264°, set 45° to the street grid, so the painting, the click map and every moving piece line up to the pixel.
Building footprints, addresses, parcels and zoning from City of Brantford open data; heights from NRCan's 2017 LiDAR (1 m surface and ground models); shops and hours from OpenStreetMap and Overture Maps; histories from Canada's Historic Places, Wikidata and local sources.
Python scripts build every building from its footprint and LiDAR height, drape the terrain, and import Google's photorealistic 3D city tiles. One camera, one scale (0.125 m per pixel), and the map grows block by block without the old blocks moving.
Each 2048-pixel view of the render is redrawn as pixel art by Google's Gemini image model with a strict "draw only what is there" brief. Views are stitched along seams that follow streets and avoid buildings; bad paintings (invented towers, a whole fake city in empty space) were caught and repainted.
A hidden ID render gives every building, and every storefront split along property lines, its own colour. The page reads that colour under your cursor, so hovering and clicking always hit the right building.
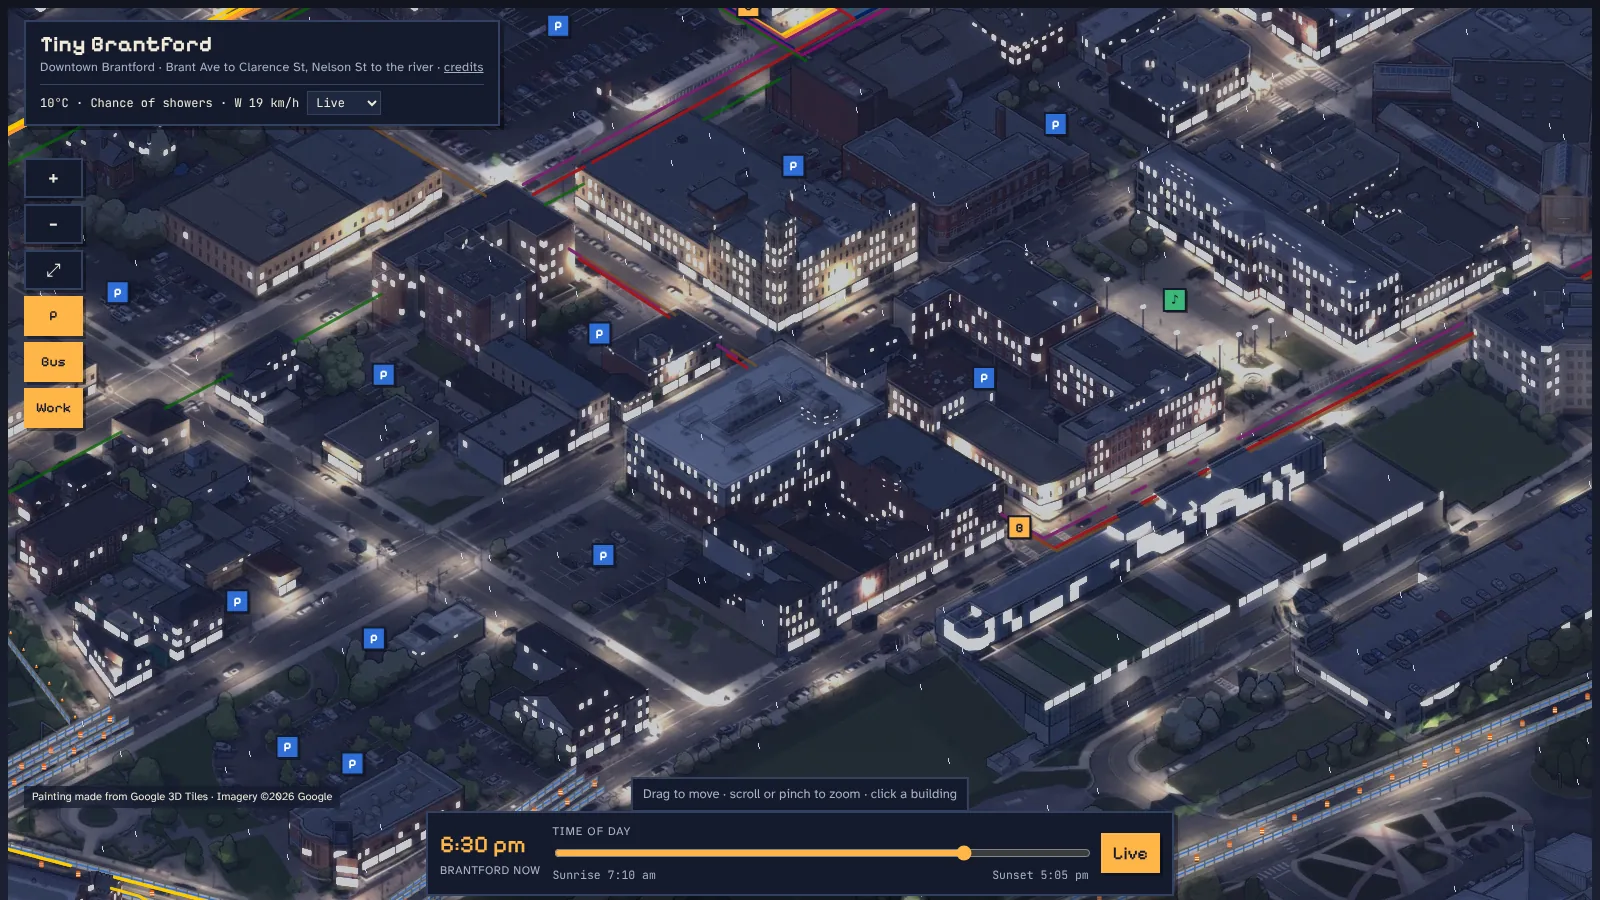
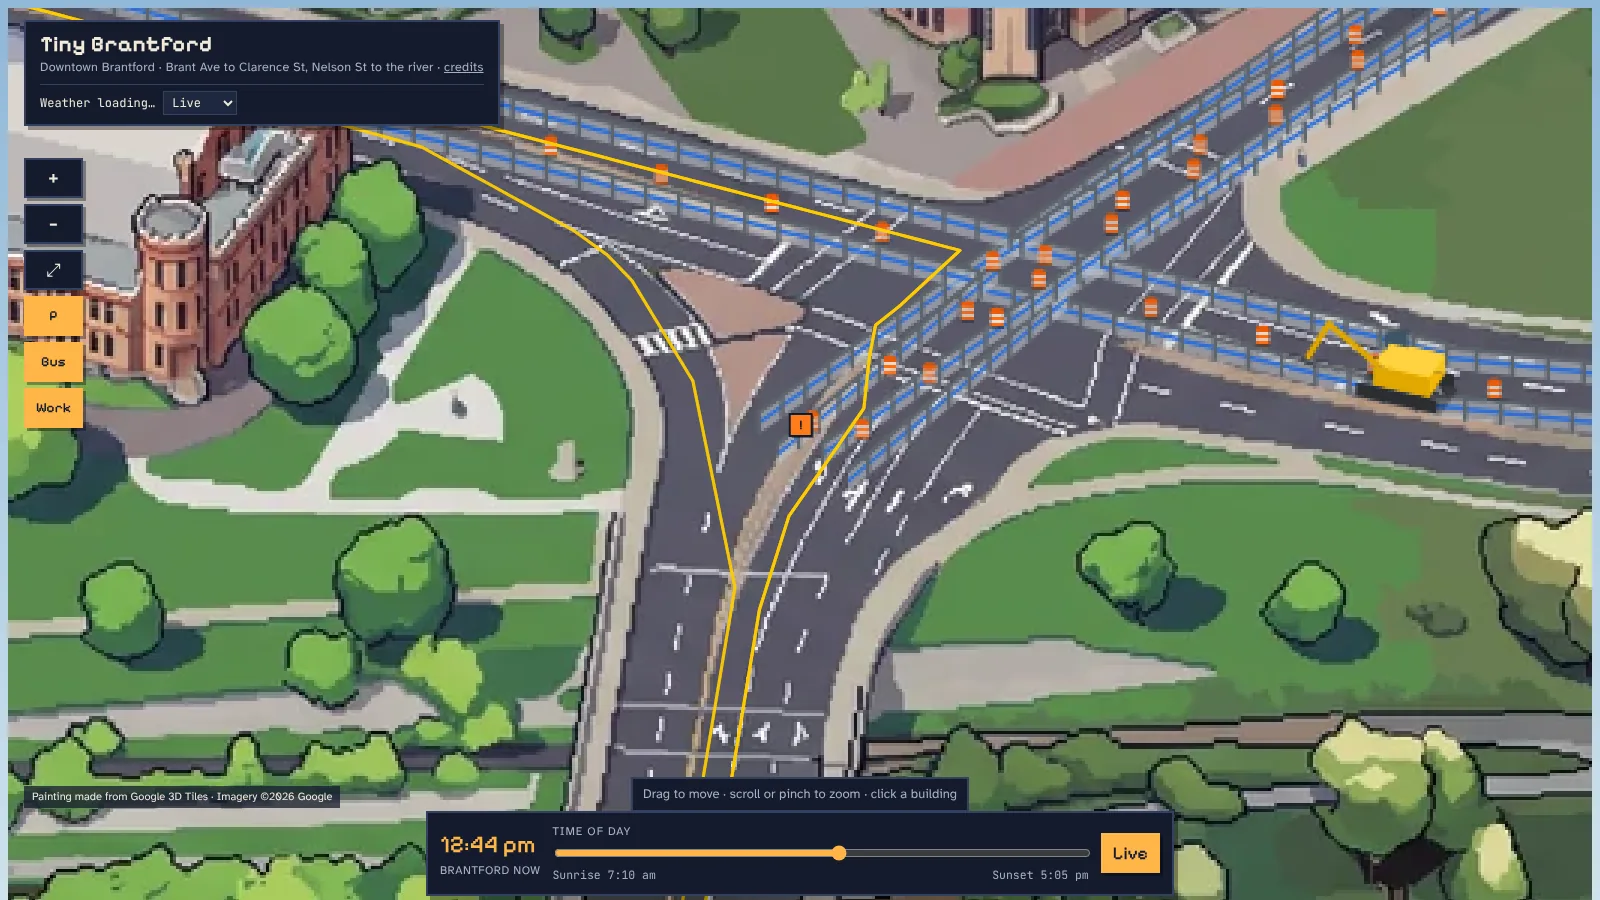
Night is the day painting dimmed to moonlight plus lit windows and streetlights rendered in Blender. Live Environment Canada conditions drive rain, snow, fog and clouds. Buses follow Brantford Transit's published timetable, and the City's live road-closure feed places pixel cones, barricades and fencing on the street.
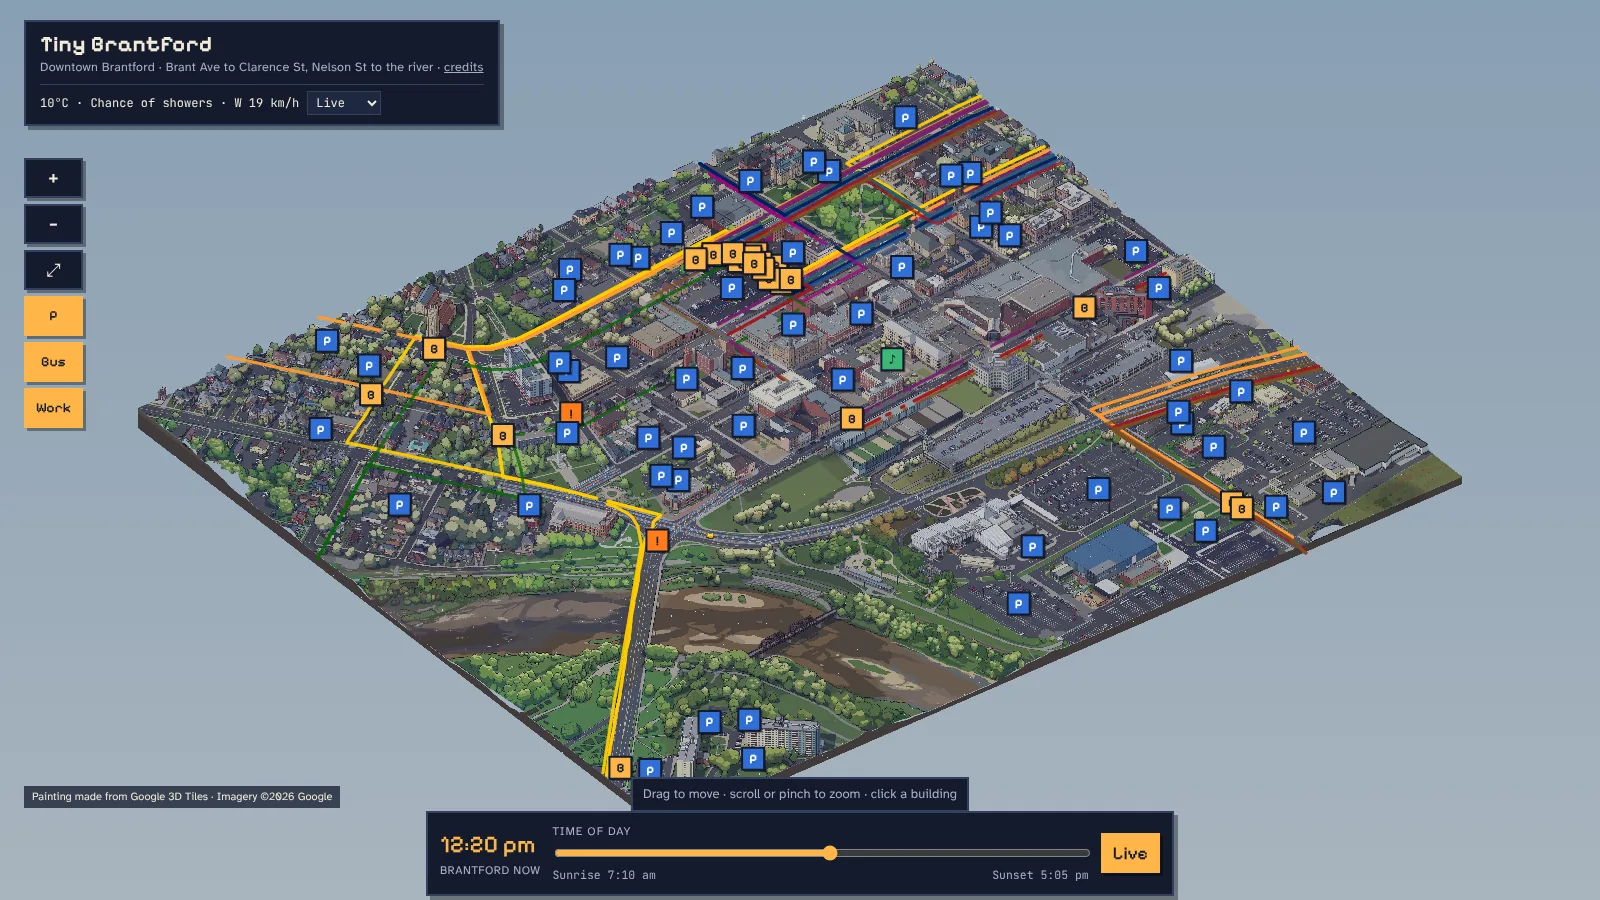
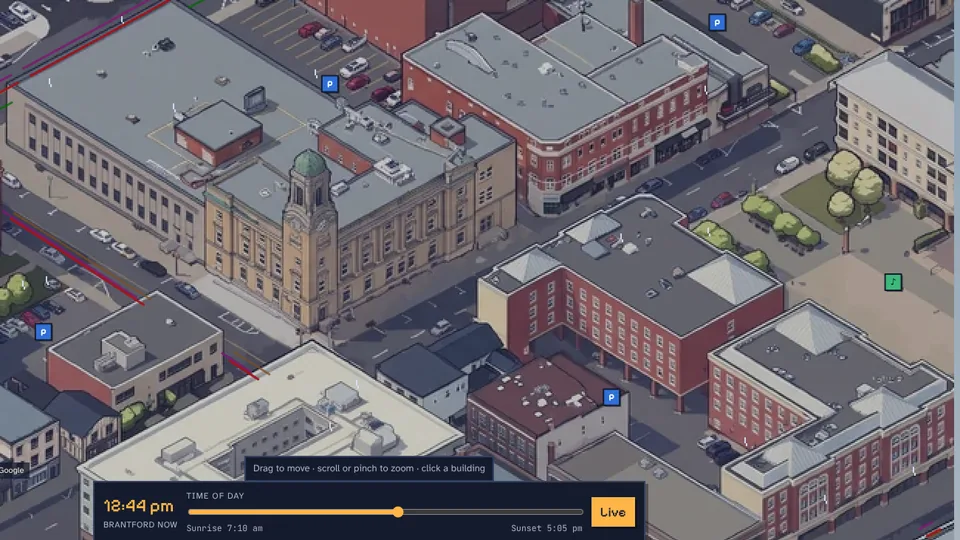
The finished map covers about a square kilometre of downtown, with history cards for 31 landmarks, photo galleries, and opening hours for the shops that publish them. Four blocks took around 50 AI-painted views (plus about 20 rejected ones), and the map keeps itself current: closures, weather and buses update on their own.
What I learned: AI painting is only as good as the guard rails around it. The real work was the pipeline: fixed scale, exact alignment, seam-cutting, and checking every painted view against the data before it went in.
Painting made from Google Photorealistic 3D Tiles (Imagery ©2026 Google). Data from City of Brantford Open Data, NRCan (Open Government Licence – Canada), © OpenStreetMap contributors, Overture Maps, Brantford Transit, and Environment and Climate Change Canada. Photos from Wikimedia Commons contributors. Full list on the credits page.